April 7,2021
Why Data Scientists Should Embrace Graphic Analysis
About Data Scientists Should Embrace Graphic Analysis
Visualizing data has become an indispensable art and practice that has proven instrumental in bridging the gap between comprehension of the human mind and digitized interpretation of a computer, thus, drawing meaningful analytical insights from mounds of data. Data scientists, who straddle the worlds of business and IT using technical and analytical skills to find concrete answers to complex questions turning a mix of mathematics and computer science to predict trends can leverage the ease and efficiency brought into the process by graphic analysis. This becomes especially pertinent in the present scenario where every business establishment, big or small, is dealing with data. Newer, more innovative ways are continually being explored to make data analytics easier and more meaningful. As of today, graphic analysis, is leading the way vis-a-vis technique innovation for filtering out optimum meaningful insights from an existing data pool.
What is Graphic Analysis?
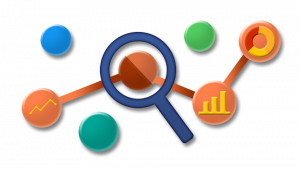
Graphic analysis or graph analytics, also commonly referred to as network analysis, is a relatively new and upcoming area of data analytics. One of the main reasons behind graphic analysis’ sudden rise to popularity in the data analytics circles is its ability to accurately process social network influencer analysis. That’s an area marketing professionals and business owners are definitely interested in, given its potential to create well targeted campaigns capable to going viral on the internet, thus, driving sales.
Graphic analysis goes beyond the realm of simple data visualizations, and works with edges and nodes, referred to as vertices in mathematical terms. In the world of analytics, these nodes can represent anything from customers to employees, buildings, cities, twitter handles, web pages, etc. can represent parameters such as likes, dislikes, interactions, engagement and so on. So, graphic analysis works on establishing patterns, commonalities and co-relations between two very different variables.
While use of graph analytics for driving business growth is emerging as its primary application, several other potential uses of this technique exist:
- Detecting frauds and financial crimes.
- Preventing and solving crime.
- Counter-terrorism operations.
- Grid and network quality check for transportation networks, power grids, and water grids.
- Optimizing logistics chain supply for manufacturing industries.
- Optimizing airline routes.
- Assisting bioinformatics research.
Why Graphic Analysis is an Important Tool for Data Scientists
With new sources of data springing up every now and then, and a constant endeavor to establish co-relations between different data points, graphic analysis is becoming increasingly popular for its sheer ease and effectiveness. Some of its key advantages include:
Time Efficient:
In contrast to most other techniques used by data scientists, graphic analysis is less time-intensive in organizing data. It also makes including more data points and sources in an ongoing analysis effortless. In traditional analytics practices, the entire onus of drawing insights from reported data falls on the data scientist. However, graphic analysis can actually do that job for you, quickly and seamlessly.
Convenient:
Graphic analysis is also a lot easier to work with as compared to other analytics techniques. In contrast to compiling different set of data one by one and then coming up with a result that combines the inputs of each data set, this technique merges the entire data at once to reflect meaningful information. This makes graphic analysis an easier model to store, analyse and retrieve data.
Eye-catching Visualizationt:
Eye-catching visualization of data is definitely a big plus of working with graphic analysis. Data presented in form of graphs is not only easier on the eye but also a more practical and easy comprehension. Due to this attribute, graphic analysis is a better-suited technique for processing large mounds of complex data into easy to understand representations that even a lay person can make sense of.
Finding Complex Answers:
The whole idea behind data science is to use an assortment of figures and information to find answers to complex questions. Once again, graphic analysis fares better than other analytics techniques in achieving this. Apart from answering questions such as ‘what’s the most important customer base for a business’ or ‘which is the best selling product for a business’, graphic analysis can also address tangential questions such as operational risks or financial viability for a business venture. This ability to find answers to complex questions and making it look effortless rests on the basic ease of data interpretation with graphic analysis.
Why You Should Consider Adopting Graphic Analysis
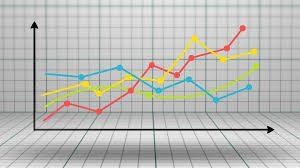
Nearly every tech giant today is incorporating graphic analysis into their operations. Be it Google using Knowledge Graph for search engine recommendations or social media platforms like Facebook and Twitter using algorithms such as Random Walk with Restart (RWR) and Page rank, graphic analysis is all around you. Currently, its use in detecting fake accounts and fraud on social media are being explored.
Graphic analytics is a powerful tool that can throw up relevant, indispensable insights into organisational aspects such as relationship analysis, risk management and identifying new business opportunities. In doing so, it is so intuitive that it’d be a loss for any data scientist to not leverage it to the best of its capabilities.
Reference links
https://towardsdatascience.com/to-all-data-scientists-the-one-graph-algorithm-you-need-to-know-59178dbb1ec2https://www.ibmbigdatahub.com/blog/what-graph-analyticshttps://www.dataiku.com/solutions/use-cases/graph-analytics/https://www.sas.com/en_in/insights/analytics/what-is-a-data-scientist.htmlhttps://www.kdnuggets.com/2018/10/graphs-next-frontier-data-science.htmlPrevious
Get Free Career Advice
Related Articles
2nd April, 2021
The Most in Demand Skills for Data Scientists
No doubt,this is the best time to become a data scientist, or so says a report from Indeed....

1st April, 2021
Technology and Employment: Do Future Employers Need Humans?
EWe’re in midst of a technological and scientific revolution...


